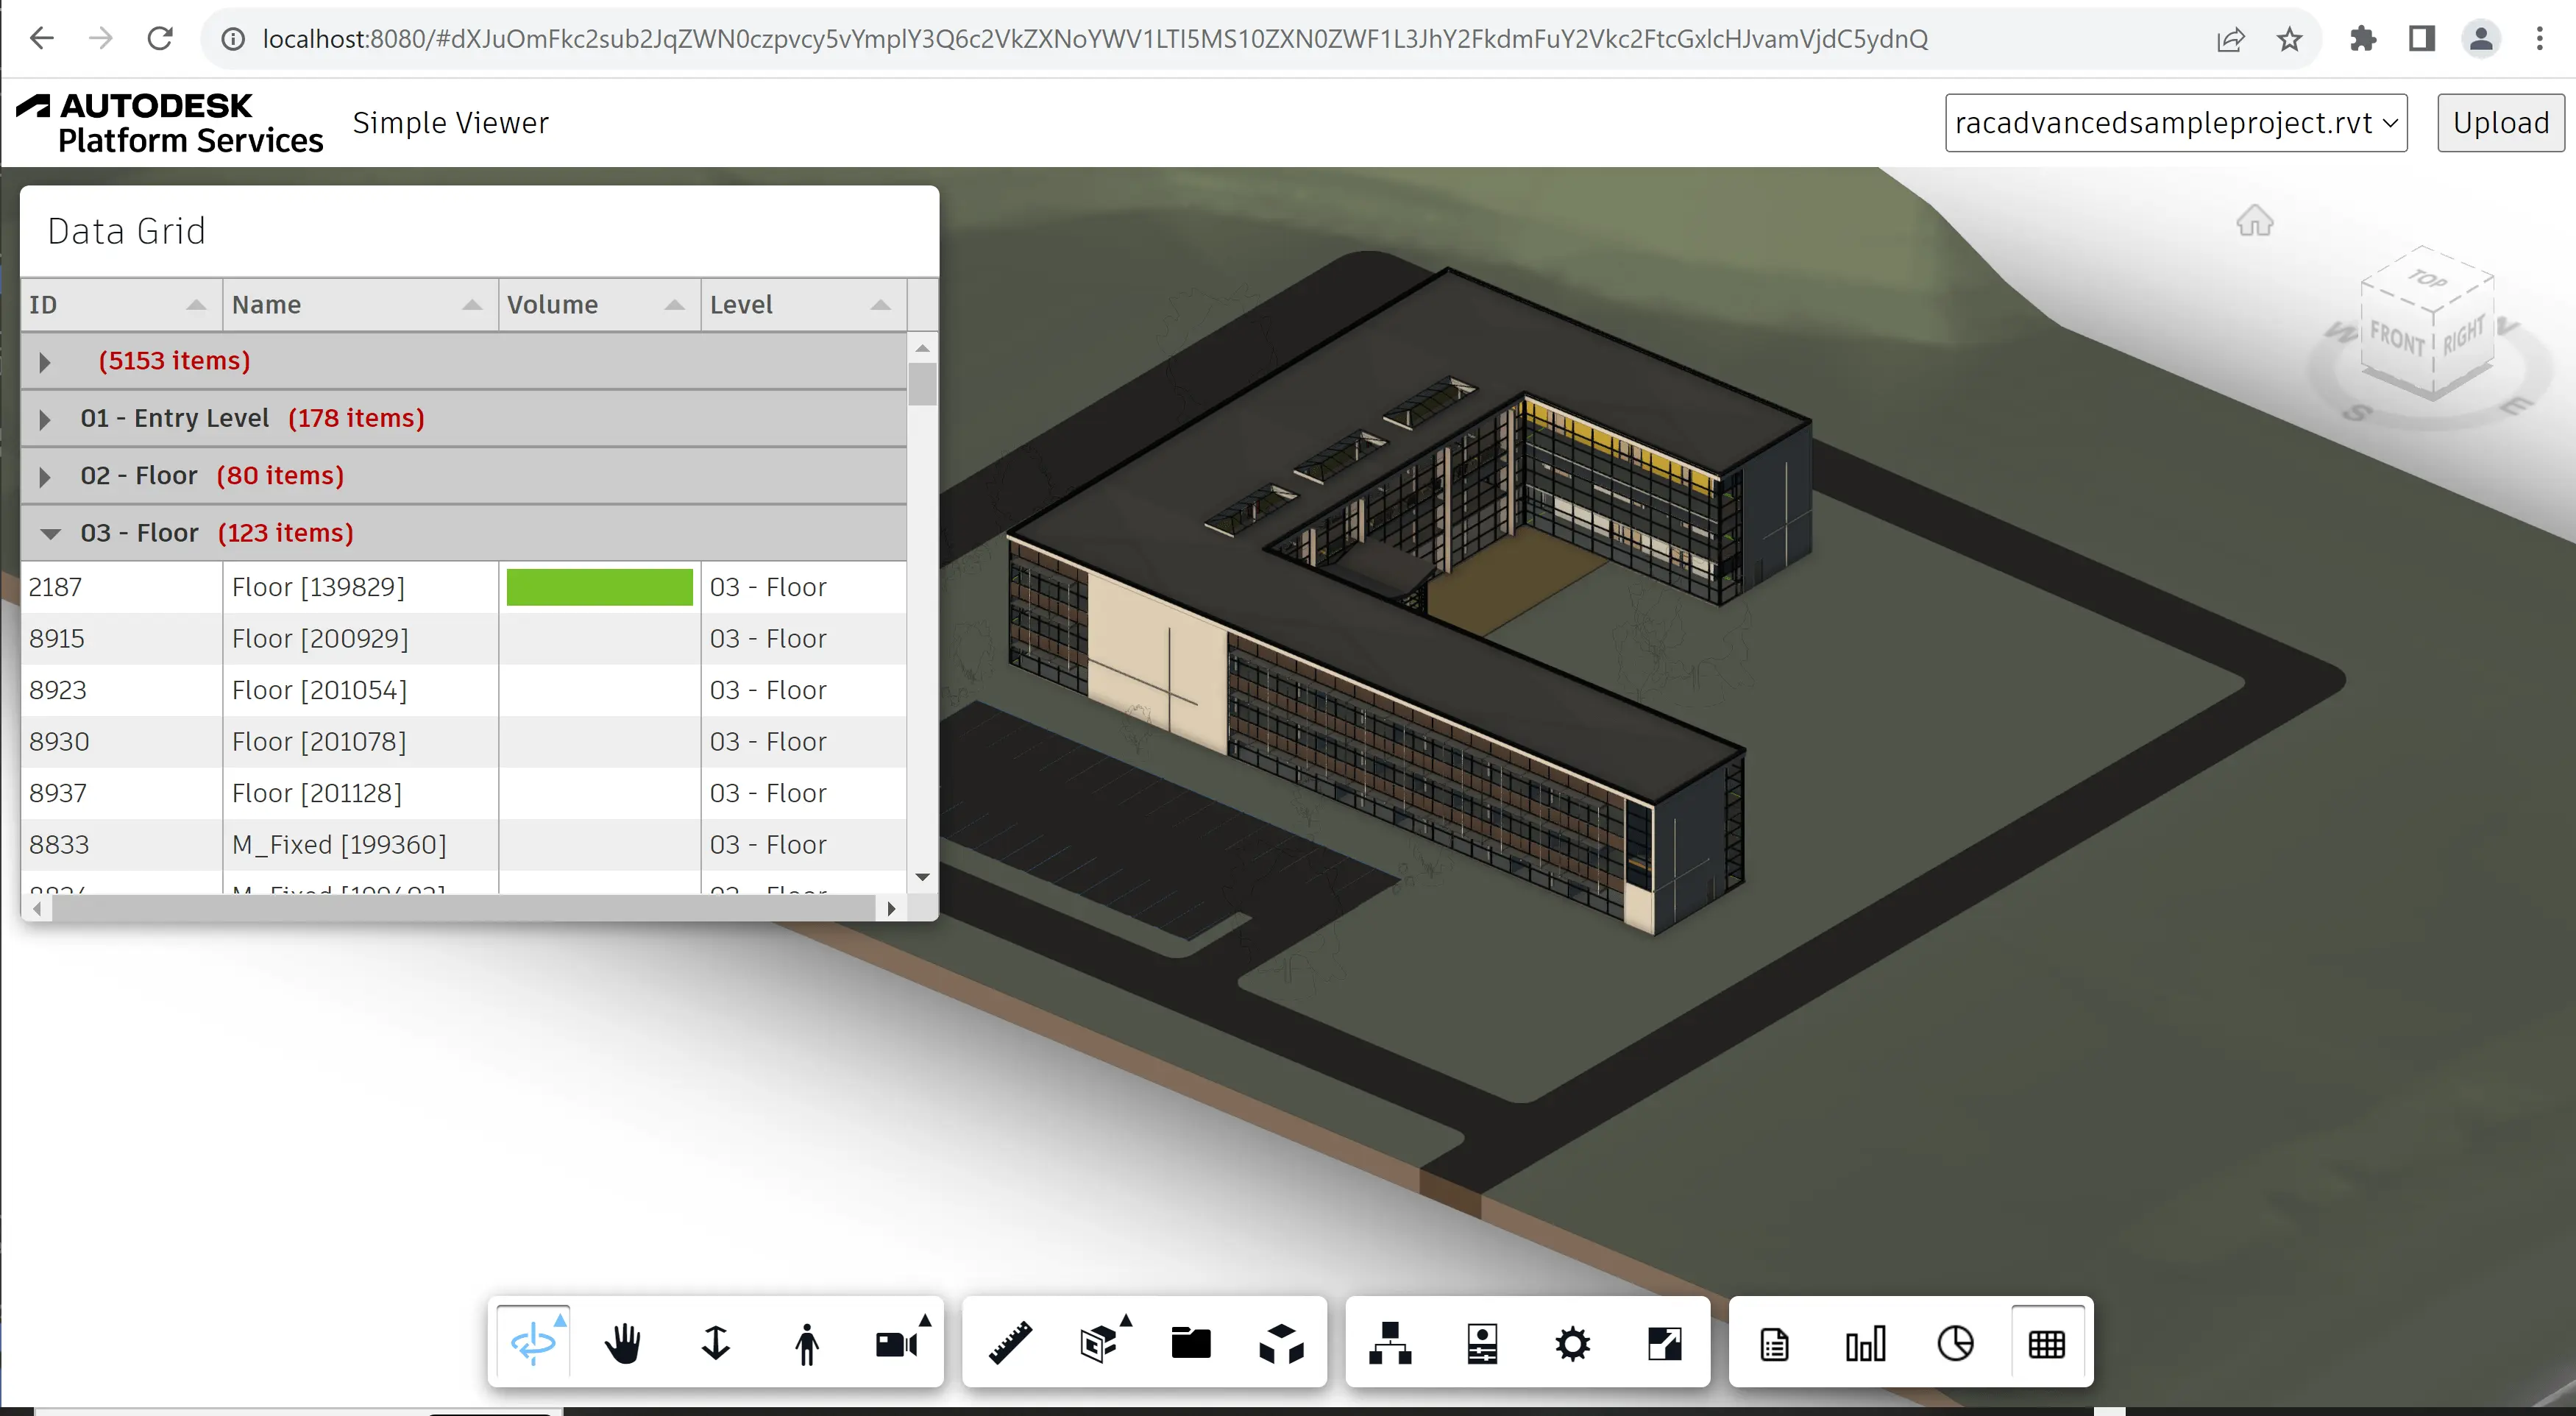
Data Grid
In this final step we will build a viewer extension that will provide a datagrid view of our design element properties using the open source Tabulator library.
Extension skeleton
As usual, let's create a new file under the extensions subfolder, call it DataGridExtension.js,
and populate it with the following code:
import { BaseExtension } from './BaseExtension.js';

class DataGridExtension extends BaseExtension {
    constructor(viewer, options) {
        super(viewer, options);
    }

    async load() {
        super.load();
        await Promise.all([
            this.loadScript('https://unpkg.com/tabulator-tables@4.9.3/dist/js/tabulator.min.js', 'Tabulator'),
            this.loadStylesheet('https://unpkg.com/tabulator-tables@4.9.3/dist/css/tabulator.min.css')
        ]);
        console.log('DataGridExtension loaded.');
        return true;
    }

    unload() {
        super.unload();
        console.log('DataGridExtension unloaded.');
        return true;
    }
}

Autodesk.Viewing.theExtensionManager.registerExtension('DataGridExtension', DataGridExtension);
This time we're also loading multiple dependencies that are required by the Tabulator library.
Now let's import the JavaScript file to our application, and pass the extension ID to the viewer constructor:
import './extensions/LoggerExtension.js';
import './extensions/SummaryExtension.js';
import './extensions/HistogramExtension.js';
import './extensions/DataGridExtension.js';
const config = {
    extensions: [
        'LoggerExtension',
        'SummaryExtension',
        'HistogramExtension',
        'DataGridExtension',
    ]
};
const viewer = new Autodesk.Viewing.GuiViewer3D(container, config);
Toolbar
Next, let's update the DataGridExtension class so that it adds a new button to the viewer
toolbar when the extension gets loaded:
import { BaseExtension } from './BaseExtension.js';

class DataGridExtension extends BaseExtension {
    constructor(viewer, options) {
        super(viewer, options);
        this._button = null;
    }

    async load() {
        super.load();
        await Promise.all([
            this.loadScript('https://unpkg.com/tabulator-tables@4.9.3/dist/js/tabulator.min.js', 'Tabulator'),
            this.loadStylesheet('https://unpkg.com/tabulator-tables@4.9.3/dist/css/tabulator.min.css')
        ]);
        console.log('DataGridExtension loaded.');
        return true;
    }

    unload() {
        super.unload();
        if (this._button) {
            this.removeToolbarButton(this._button);
            this._button = null;
        }
        console.log('DataGridExtension unloaded.');
        return true;
    }

    onToolbarCreated() {
        this._button = this.createToolbarButton('dashboard-datagrid-button', 'https://img.icons8.com/small/32/activity-grid.png', 'Show Data Grid');
        this._button.onClick = () => {
            // TODO
        };
    }
}

Autodesk.Viewing.theExtensionManager.registerExtension('DataGridExtension', DataGridExtension);
Data grid
Now let's create a custom docking panel that will host the actual Tabulator grid. Create
a DataGridPanel.js file in the same folder where DataGridExtension.js is located, and
add the following code to it:
const DATAGRID_CONFIG = {
    requiredProps: ['name', 'Volume', 'Level'], // Which properties should be requested for each object
    columns: [ // Definition of individual grid columns (see http://tabulator.info for more details)
        { title: 'ID', field: 'dbid' },
        { title: 'Name', field: 'name', width: 150 },
        { title: 'Volume', field: 'volume', hozAlign: 'left', formatter: 'progress' },
        { title: 'Level', field: 'level' }
    ],
    groupBy: 'level', // Optional column to group by
    createRow: (dbid, name, props) => { // Function generating grid rows based on recieved object properties
        const volume = props.find(p => p.displayName === 'Volume')?.displayValue;
        const level = props.find(p => p.displayName === 'Level' && p.displayCategory === 'Constraints')?.displayValue;
        return { dbid, name, volume, level };
    },
    onRowClick: (row, viewer) => {
        viewer.isolate([row.dbid]);
        viewer.fitToView([row.dbid]);
    }
};

export class DataGridPanel extends Autodesk.Viewing.UI.DockingPanel {
    constructor(extension, id, title, options) {
        super(extension.viewer.container, id, title, options);
        this.extension = extension;
        this.container.style.left = (options.x || 0) + 'px';
        this.container.style.top = (options.y || 0) + 'px';
        this.container.style.width = (options.width || 500) + 'px';
        this.container.style.height = (options.height || 400) + 'px';
        this.container.style.resize = 'none';
    }

    initialize() {
        this.title = this.createTitleBar(this.titleLabel || this.container.id);
        this.initializeMoveHandlers(this.title);
        this.container.appendChild(this.title);
        this.content = document.createElement('div');
        this.content.style.height = '350px';
        this.content.style.backgroundColor = 'white';
        this.content.innerHTML = `<div class="datagrid-container" style="position: relative; height: 350px;"></div>`;
        this.container.appendChild(this.content);
        // See http://tabulator.info
        this.table = new Tabulator('.datagrid-container', {
            height: '100%',
            layout: 'fitColumns',
            columns: DATAGRID_CONFIG.columns,
            groupBy: DATAGRID_CONFIG.groupBy,
            rowClick: (e, row) => DATAGRID_CONFIG.onRowClick(row.getData(), this.extension.viewer)
        });
    }

    update(model, dbids) {
        model.getBulkProperties(dbids, { propFilter: DATAGRID_CONFIG.requiredProps }, (results) => {
            this.table.replaceData(results.map((result) => DATAGRID_CONFIG.createRow(result.dbId, result.name, result.properties)));
        }, (err) => {
            console.error(err);
        });
    }
}
To keep things simple, the DataGridPanel class is currently hard-coding the grid columns
to only show a couple of specific properties of our design metadata (specifically the object ID,
object name, and Volume and Level properties). Depending on the type of design you will be
loading into your application, you may want to change these.
Finally, add the new panel to our extension:
import { BaseExtension } from './BaseExtension.js';
import { DataGridPanel } from './DataGridPanel.js';

class DataGridExtension extends BaseExtension {
    constructor(viewer, options) {
        super(viewer, options);
        this._button = null;
        this._panel = null;
    }

    async load() {
        super.load();
        await Promise.all([
            this.loadScript('https://unpkg.com/tabulator-tables@4.9.3/dist/js/tabulator.min.js', 'Tabulator'),
            this.loadStylesheet('https://unpkg.com/tabulator-tables@4.9.3/dist/css/tabulator.min.css')
        ]);
        console.log('DataGridExtension loaded.');
        return true;
    }

    unload() {
        super.unload();
        if (this._button) {
            this.removeToolbarButton(this._button);
            this._button = null;
        }
        if (this._panel) {
            this._panel.setVisible(false);
            this._panel.uninitialize();
            this._panel = null;
        }
        console.log('DataGridExtension unloaded.');
        return true;
    }

    onToolbarCreated() {
        this._panel = new DataGridPanel(this, 'dashboard-datagrid-panel', 'Data Grid', { x: 10, y: 10 });
        this._button = this.createToolbarButton('dashboard-datagrid-button', 'https://img.icons8.com/small/32/activity-grid.png', 'Show Data Grid');
        this._button.onClick = () => {
            this._panel.setVisible(!this._panel.isVisible());
            this._button.setState(this._panel.isVisible() ? Autodesk.Viewing.UI.Button.State.ACTIVE : Autodesk.Viewing.UI.Button.State.INACTIVE);
            if (this._panel.isVisible() && this.viewer.model) {
                this.update();
            }
        };
    }

    onModelLoaded(model) {
        super.onModelLoaded(model);
        if (this._panel && this._panel.isVisible()) {
            this.update();
        }
    }

    async update() {
        const dbids = await this.findLeafNodes(this.viewer.model);
        this._panel.update(this.viewer.model, dbids);
    }
}

Autodesk.Viewing.theExtensionManager.registerExtension('DataGridExtension', DataGridExtension);
Try it out
Click on the new toolbar button to bring up the datagrid panel. The grid should list selected properties of all design elements, and clicking on any row in the grid should isolate the specific design element in the viewer.
